Albert Einstein once said, “You can’t use an old map to explore a new world.” It’s a quote that Ian Goldin and Robert Muggah use to start their treatise on how to make sense of the state of the world and its future through mapping.
Maps present information concisely, but they also project our biases and unwittingly lay bare what we don’t know. The earliest examples, going back three millenniums, show the known world in stylized form and the unknown world inhabited by various monstrosities. One of them, etched on clay tablets some 2,600 years ago, uses rectangles to depict the ancient city of Babylon and the Euphrates River at the centre (centrality says a lot about a map-maker’s thinking), with neighbouring settlements as circles. That which is beyond reflects the mythology of the time. Particularly in the sixteenth century, maps became more accessible to ever widening groups of users. The landmark Mercator projection of 1569, for instance, presents a spherical planet on a flat surface. The technique made navigation more accurate, but it also came with a cost: it misrepresents the relative size of land masses, showing polar regions as larger and Africa and South America as smaller than they actually are.
In recent years, a host of digital technologies have taken cartography to a different level, enabling the move to more hands-off drafting, three-dimensional portrayals, dynamism, and interactivity. Perhaps more than any other development, Google Maps has brought all manner of maps to the masses, or at least to the 60 percent of the global population that has access to the internet.
COVID-19 has also provided a boost to maps and the cogent way they present information. The estimable Our World in Data online portal has been in existence since 2011, but it has recently garnered a large fan base — 100 million in 2020 — by portraying the many facets of the pandemic through engaging, open-source, and freely available charts, tables, and maps. Similarly, imaging from NASA has helped raise public consciousness about planetary well-being in ways that no amount of textual logic and argument could.

Innovative ways to navigate a changing world.
Tom Chitty
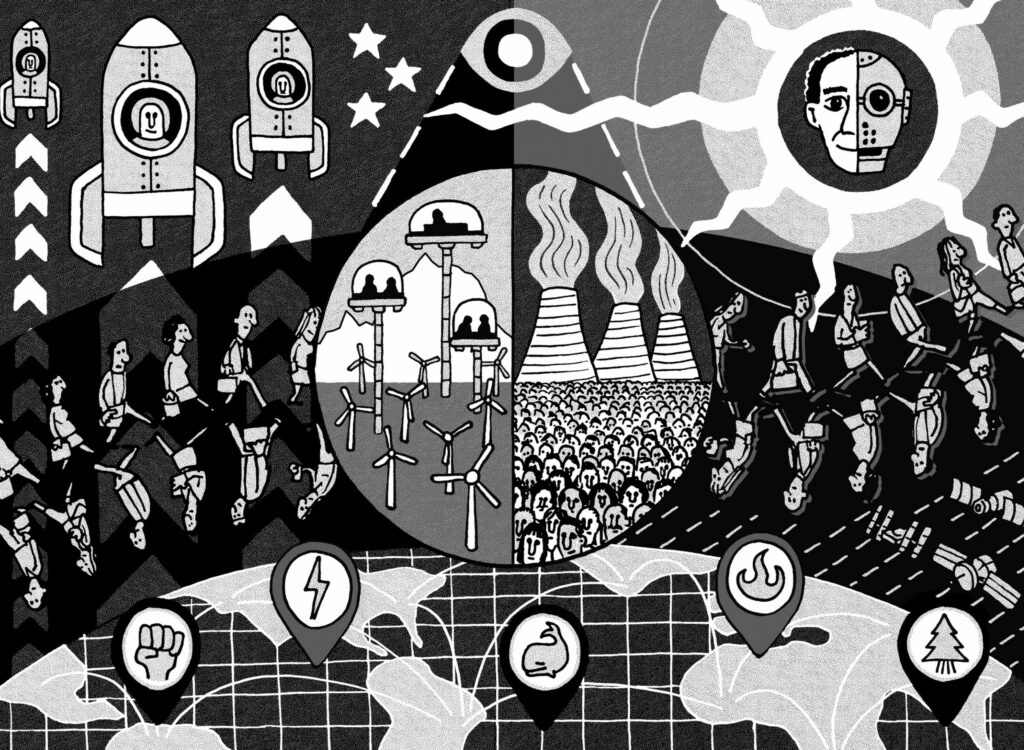
With Terra Incognita, Goldin, a South African professor at Oxford, and Muggah, a Canadian political scientist who has founded two think tanks, set out to help us “navigate the future” with maps that “are designed to guide readers to greater understanding, not to a physical place.” They organize their book in thirteen chapters, on topics ranging from climate and education to violence and food. Each chapter starts with several core messages that summarize the text and figures that follow. This pattern lends the publication a textbook quality, but it does not distract from its overall readability. Rather, the structure highlights the fact that maps never present purely objective information; they always require interpretation and nuance.
The first chapter, on globalization, begins with four overarching points: cross-border flows define globalization; globalization has lifted billions out of poverty; globalization spreads opportunities and risks; and while globalization is not dead, it is under threat. Later, a chapter on inequality notes that disparities within countries are growing; those between countries are shrinking; one’s prospects are defined by where one lives; and extreme inequality is rising.
Goldin and Muggah creatively contextualize many familiar indicators. The United Nations tells us, for example, that the world produces 300 million tonnes of plastic waste every year — a somewhat unfathomable figure. Mapping that refuse, though, helps us to see the connections between globalization, economic growth, and environmental degradation. Satellite imagery, meanwhile, can illustrate disparities in powerful ways. Consider the visual juxtaposition of New York State and Lagos, with similar populations of roughly 20 million people. On an average day, New York consumes 392 gigawatts of power, while the entire country of Nigeria consumes less than five gigawatts. Comparing the state and the city at night, then, yields a striking picture — and perhaps an easier way to portray relative inequality than conventional measures such as the Gini coefficient.
While a map can simplify — or at least present lots of data in a concise form — the main message of Terra Incognita is, sensibly, the opposite: It’s a complex world. To understand it we cannot use a single map or metric but rather must rely upon a dashboard of indicators. Yet this view raises a question: Does the book, with its compact messages at the start of each chapter, guide readers toward finding their own understanding of various issues or to the authors’ preferred conclusions?
Take the connections between globalization, inequality, and the environment. Undoubtedly, the globalization of the past few decades has been unbalanced. Financial flows, information sharing, and communications technologies have evolved extremely rapidly. International trade in goods and services has also expanded, but more slowly. Movement of people and, crucially, the creation of institutions, processes, and norms, both national and international, to manage globalization have been growing at the slowest pace. The disproportionate rewards for agility have helped drive inequality, a fact that the economist Adrian Wood first observed in the early 1990s. The footloose nature of finance and goods and services, for example, has meant that entrepreneurs and skilled workers in developed and developing countries have benefited from the connections that have emerged, while unskilled workers in developing countries have benefited at the expense of their counterparts in developed ones.
With this broad plot line in mind, some of the core statements that Goldin and Muggah make about globalization, along with the maps they present — of fibre optic cables, trade networks, and aid flow — can be interpreted quite differently. Indeed, billions have been lifted out of poverty in recent years, but in the two countries where the bulk of the lifting has happened — China and India — it has been the result of quite different policies and political systems. At the same time, a backlash has occurred, especially in developed nations, as previously thriving industrial regions have been hollowed out. If we don’t properly account for rising inequality, biodiversity loss, climate change, and other ill effects, the benefits of and threats to globalization that one chooses to map may well be overstated.
The chapter on technology also misses the mark somewhat. For one thing, it does not offer a meaningful discussion of the role that technological prowess is playing in the rise of China, as well as in the tensions between China and several countries (the chapter on geopolitics also suffers on this point). And while Goldin and Muggah discuss the good and bad effects of technology, its impacts on jobs and inequality, and the need to manage it better, they fail to consider intellectual property — a term that does not appear anywhere in their book. Yet without a proper portrayal and understanding of how innovation works, including the proprietary nature of new technologies and their relative concentration in the hands of a few, Terra Incognita does not present a realistic picture of contemporary opportunities and fault lines.
A distinct chapter with maps depicting emerging information technologies and data flows would have highlighted the exponential growth in data generation in recent years and how it is being used, mainly in the United States and China, to affect every aspect of our lives — through the surveillance capitalism that scholars such as Vincent Mosco and Shoshana Zuboff have described elsewhere. Visually indicating those countries with any sort of data protection and privacy legislation — and those with laws that actually have teeth — would make for depressing and instructive viewing indeed.
In a short concluding chapter, Goldin and Muggah highlight the question of managing risk in our hyperconnected present. They stress the importance of calculating various risks correctly, as well as the importance of collective action. The pandemic has highlighted the power of spillover effects, captured by the phrase “No one is safe until everyone is safe” and felt in the supply chain issues disrupting global trade. At the same time, a long-overdue discussion about regulating big tech is showing how public awareness and public pressure can prompt the creation of necessary institutions to manage the digital era.
Of course, institutional change is both difficult to portray and hard to achieve. But, more than ever, we have to explore new rules for the future of globalization, and we need usable, convincing data and analysis for the journey. Ultimately, this book shows how innovative maps can help.
Rohinton Medhora is a professor of practice at McGill’s Institute for the Study of International Development and a distinguished fellow at the Centre for International Governance Innovation.
Related Letters and Responses
@robmuggah via Twitter

